I challenged my seventh grade advisory, as the culminating project of our LightLogo unit, to create monuments that incorporated LightLogo and materials they had around their homes. The monuments needed not be serious: it could be to the best sandwich you ever ate, for example. I went serious with mine, however, and used LightLogo and wood blocks to display Covid-19 deaths in Connecticut between March 19, 2020 (the first recorded death) to February 16, 2021.

My monument is located in a park in Hartford, the capital of Connecticut. It memorializes deaths in the state from Covid-19 from March 19, 2020 to February 26, 2021. Because it is built on data the monument could be updated monthly/weekly/daily to reflect the most current numbers.
The colors are arranged in the default ROYGBIV numbering scheme used by LightLogo. The procedure assigns colors to each number accordingly. Zero is rendered as white.

The wood blocks on which the light shines are arranged in a specific order.
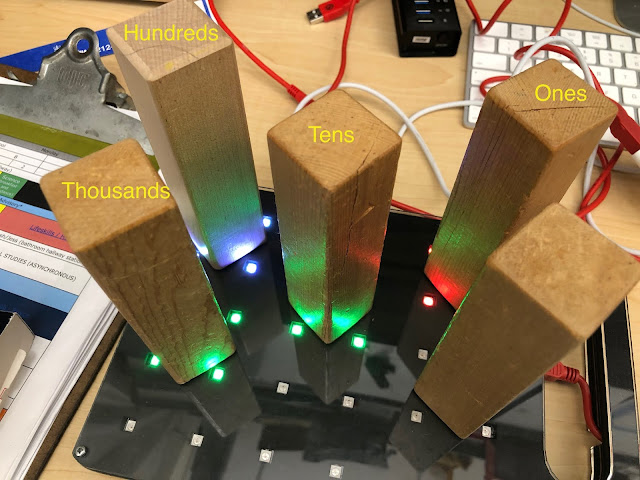
If this monument were to be fabricated I would make blocks be much larger, perhaps 12 feet tall and proportionally wider as well. I think the natural material and the way it would weather outside would look beautiful and would reflect the people’s lives that were cut short because the material was harvested from a living organism. In real life I fabricated it with wood play blocks and the LightLogo grid I built a few years ago. Currently there are four blocks on the monument as there are over 6,000 deaths in Connecticut as of February 26, 2021.
What strikes me about this monument and the way that it visualizes data and memorializes so many people is that the more beautiful the monument is (because of the duration of its display, because of the variety of colors it uses) the more tragic it is.
Technical Information
This was a great project for me because Brian introduced to me an undocumented feature in LightLogo to handle lists of data. Additionally, it was a great project to make me think about how you represent data and how you program data to be represented. It was one of the most mentally engaging projects I have worked on in a long time.
Building Lists
To create a list, or array, in LightLogo, you create a procedure and use brackets and a pound sign to denote that you are creating a list of decimal numbers. The numbers must be smaller than 255.

Getting the Data
The data for this project was taken from a public repository. I used Excel to copy the column of mortalities from the original spreadsheet. Then I moved the four digit numbers into single columns. The data was copied into TextEdit and formatted into the lists.
Using the Data
Four different data procedures held the data for the 1s, 10s, 100s, and 1000s. Each had the same procedure to read the data and assign a color to the number it retrieved from the list. Using a variable, called infection1 in the example below, and increasing the variable by 1 in each loop of the procedure allows LightLogo to step through the data.

Each block has a procedure that maps their location on the grid and turns on four LEDs around the base of each.

The startup procedure brought all the parts together.

At the end of the data the procedure resets the board and starts over at the beginning. I found a reset, not a clean, was necessary because otherwise the data would start to corrupt as the microcontroller, I believe, ran out of memory. The reset command worked to start over and has allowed the hardware to run uninterrupted for 36+ hours at this writing.

I was really happy to be able to visualize what I wanted the monument to accomplish and to figure out how best to step through the data to visualize the numbers. I am always surprised to learn about more undocumented features in LightLogo and to put them to use in my work.
Comments